
Sort and View Organization’s Database
After you create an organization, it appears in the Organizations database. This works much like an Excel sheet—each row is an organization, and the columns show details like Name, Type, Phone Number, Email, Address, Referral Source, Created Date, and more.
You can:
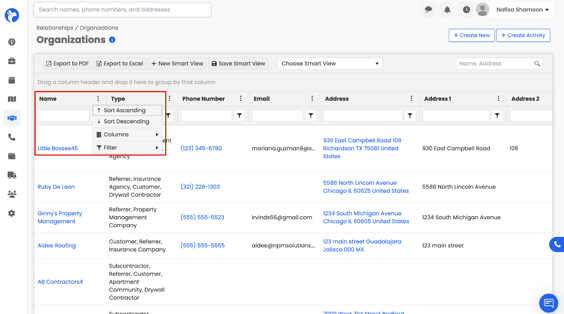
- Sort columns in ascending or descending order (e.g., sort by name A–Z).
- Filter columns to quickly find what you need. For example, you can filter by type to only see Property Management Companies, or filter by referral source to only see Online Marketing.
- Search across columns to show only values that contain certain information, like phone numbers starting with a specific area code or addresses in a certain city.
- Scroll left to right to view all stored details for each organization.
Example: If you want to see only property managers you added in the past month, you can filter the Type column to “Property Management Company” and the Created Date column to the last 30 days.
Export to PDF
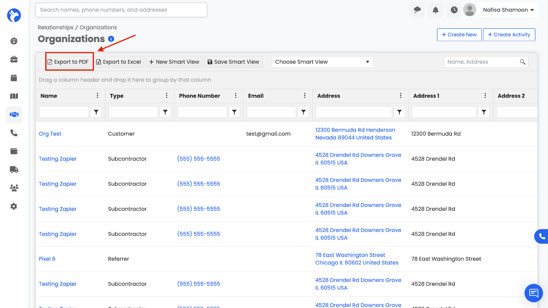
The Export to PDF option lets you download and save all the information you see in the Organizations database into a PDF file. This is useful if you need a copy of your data outside of Albi—for example, to share with someone who doesn’t have access to the system, to print records, or to keep a backup.
When you click Export to PDF, the system will generate a file with the details of the organizations currently displayed in your view. If you’re using filters or Smart Views, only the filtered results will be included in the export.
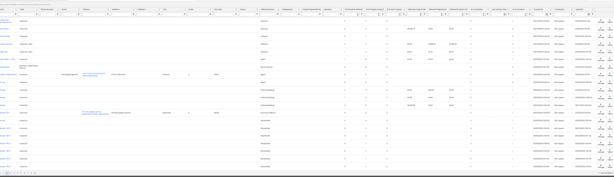
The exported PDF document will appear as shown below:
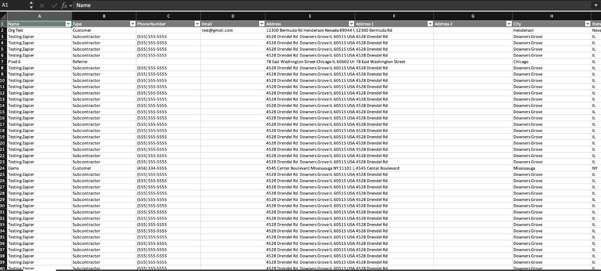
Export to Excel
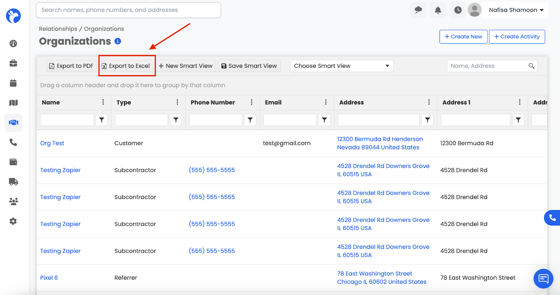
The Export to Excel option allows you to download your Organizations data into an Excel (.xlsx) file. This is especially useful if you want to do extra analysis, sort and filter data in more detail, or share the information with someone who prefers working in spreadsheets.
When you click Export to Excel, the system will generate a file with the details of the organizations currently visible in your view. If you’re using filters or Smart Views, only those filtered results will be included in the export.
The exported Excel document will appear as shown below:
Smart Views
Smart Views are saved filters you create so you can quickly jump to just the groups of organizations you want to focus on. Once you set it up, you don’t have to recreate the filters each time.You can create Smart Views for yourself, for specific staff, or share them company-wide.
How to Create a Smart View
- Go to Relationships → Organizations.
- Apply filters to show the set of organizations you want (for example: choosing a “Type”, setting a “Created Date”, or any other criteria).
- When you’ve got your filtered list ready, click Save Smart View or New Smart View.
- In the pop-up:
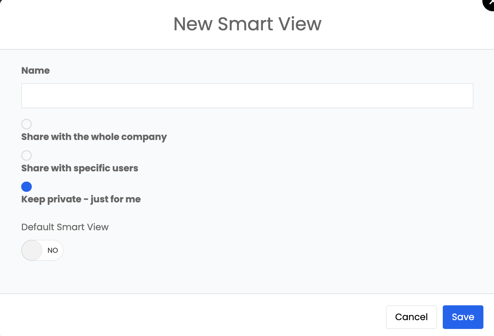
- Enter a Name for your new view.
- Choose who can see the view:
- Keep private – just for me
- Share with specific users
- Share with the whole company
- Optionally mark it as your Default Smart View so it loads when you open the screen.
5. Click Save. Your new Smart View will now appear in the drop-down list of views.
6. After saving, your Smart View will appear in the drop-down list. You can switch between different views anytime without reapplying filters.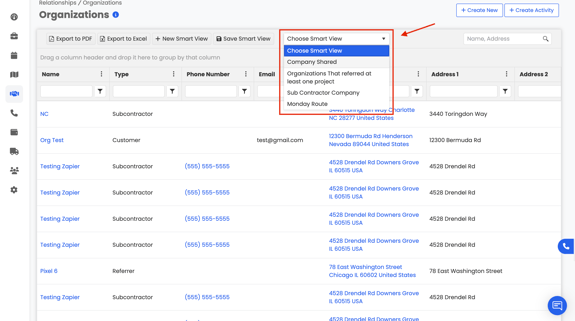
Editing and Deleting Smart Views
You can edit or delete any Smart Views that you have created:
- Go to your Profile → Preferences tab.
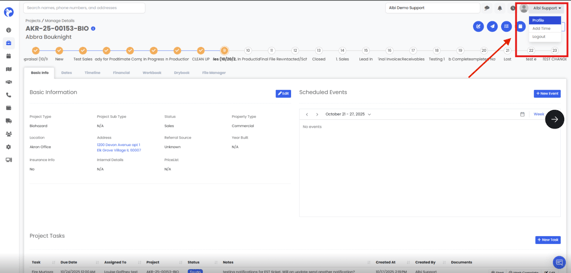
- Under Smart Views, you’ll see a list of all the Smart Views you’ve created, as well as any that have been shared with you by other team members.
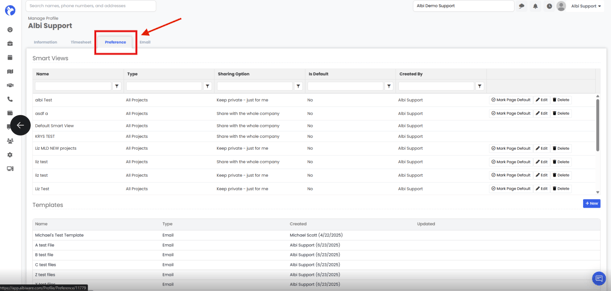
- From here, you can edit, rename, or delete your own Smart Views.
- Shared Smart Views that were created by others will be visible but cannot be modified unless you’re the creator